Thursday, March 31, 2005
Wednesday, March 30, 2005

With the DJIA closing up 135 points today, the exit of our hypothetical short trade yesterday looks great. If you look on the chart, the bar for today looks similar in length and height to yesterday's price bar (except for the closes of course). The indicators below tell another story, however. The stochastics is close to breaking above 20, which would indicate a buy signal. Let's see how this plays out over the next two sessions of this week.
So far: +165 points
Tuesday, March 29, 2005

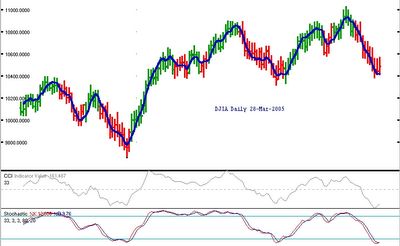
The Dow closed down about 80 points today. This could be a pause in the downtrend still or a continuation of it.
We'll see how tomorrow plays out, but the market is very oversold.
According to what I wrote yesterday, I'll exit the hypothetical trade from 10728 today and again to be very conservative about it, I'll consider that I got out at the worst possible price of the day--the high of 15565. This adds up to an extremely conservative +165 Dow points for this trade.
I'll keep a running total at the bottom of each day's entries.
+165 points
Monday, March 28, 2005

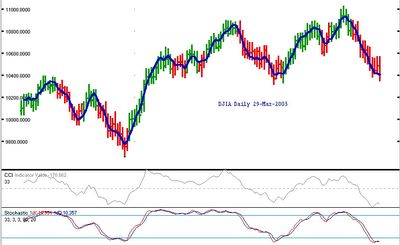
The Dow closed up 43 points on the first trading day of the week. The question is, "Is this the end of the downtrend, or just a pause before it resumes?" According to my hypothetical trading methodology, I decided to exit when the moving average turned up after the stochastics crossed below the 20 line. Today was that day, so tomorrow I'll exit the hypothetical trade. If you look closely on the chart, it doesn't always catch all of a move, but gets me out during a sideways movement which may or may not resume in the previous direction of the trend (down in this instance). It is just a slight upward move in the moving average, so depending on how this turns out, I may want to adjust the exit strategy for future hypothetical trades.
As of today's close, the hypothetical trade is: +243 points
Thursday, March 24, 2005
Weekly DJIA through 21-Mar-2005

The weekly Dow took another pounding, closing down 186 points on the week. The Stochastics indicator has now dropped below 80 and the CCI is close to crossing the zero line. This chart looks worse than the daily one in that this decline is just starting instead of well along. Judging by this chart, the Dow is due for quite a bit a drop in the short term.

What looked for most of the day like an up day turned lower near the close. The DJIA went down 14 points all the while making an inside day. The Stochastics indicator dropped even lower, but the CCI turned up a little (due to the inside day, I think). The market still looks weak and today might be a halfway point toward a major low. The next level of support is 10317 and we should test it in the next session (Monday).
As noted yesterday, the market won't decline every day in a downtrend so Monday may dip in the morning and recover for a positive close, or the next up day might be Tuesday if the market gets clobbered on the first day of the week.
Our hypothetical short trade from 10728 is now: +286 points.
Wednesday, March 23, 2005

The Dow closed down 14+ points but it was an up-and-down day. The market is still set to go lower, but it can't decline in a straight line; there must be an up day in there somewhere. With that said this looks like a perfect and orderly downtrend thus far. Will we see 10250?
Hypothetical trade result as of today: +272 points
Tuesday, March 22, 2005

The DJIA closed down 94+ points today, much of the loss occurring late in the day. Although everything points to lower prices, the stochastics indicator did go below 20 today, showing the first indications of the market being oversold. We may see a little sideways or even small blip upward tomorrow, but this market still looks bad.
The hypothetical short trade from 10728 is now: +258 points
Monday, March 21, 2005
Sunday, March 20, 2005
Weekly DJIA through 14-Mar-2005
The weekly DJIA closed 144+ points lower this week. As expected, with a lower close the price bar has turned red and the indicators continue to turn south. The Stochastics indicator is still >80, but one more down week would put it below that trigger level. Everything on the chart points to lower prices, except that we've had weeks in the past few months which closed lower then bounced back with a reversal price bar the next week. If that happens, the downside will be very limited, but if the market moves sideways to lower this week, the market should decline a few hundred more points, at least.
As mentioned in the last post, due to technical problems, I'm unable to post my charts this weekend. If I am able to later, I will amend this post with the chart for this week.
As mentioned in the last post, due to technical problems, I'm unable to post my charts this weekend. If I am able to later, I will amend this post with the chart for this week.
The Dow ended the week up 3 points. It looked like a down day, more than 60 points lower at one time will continue until the final bell, but a rally ensued. The indicators are still lower and our hypothetical trade is still up +99 points.
Due to technical difficulties, I can't post my charts this weekend. The analysis for the weekly chart will follow, but I'll say that, as expected, it turned lower as well.
Due to technical difficulties, I can't post my charts this weekend. The analysis for the weekly chart will follow, but I'll say that, as expected, it turned lower as well.
Thursday, March 17, 2005

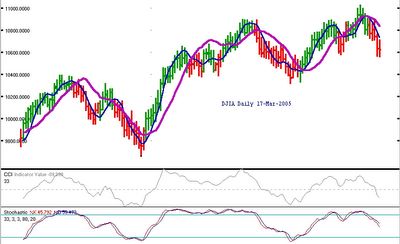
An indecisive day in the Dow today, ending with a 6+ point loss on the average. This indecision day looks like a halfway point in this down move, which would estimate a target of around 10275. Tomorrow will either be another wishy-washy day or will drop a good amount.
My hypothetical trade short is now: +102 Dow points
Wednesday, March 16, 2005

A 112 point drop today in the Dow and our signal profits more and more. The indicators have all turned markedly lower. Note: I've changed from a 13-bar CCI to a 33-bar one to give a longer term picture of the market and take out some small noise in the indicator. No projection yet on how far this will go.
Our hypothetical profit so far: +95 points
Tuesday, March 15, 2005

Another reversal day, this time with the market closing down 59 points. The downtrend is now fully in place, I think and has a way to go. With a down week, the weekly chart will also turn decidedly bearish. Everything is pointing to lower prices on the Dow. What will be the "fundamental" news excuse for this: Oil prices, a weak job market? Whatever the "reason" given, the market should go lower and quickly so.
The hypothetical short entry we made is now -17 points. (This was corrected on 3/16)
Monday, March 14, 2005

Although the Dow was up 30 points and made a reversal day, the market still looks very weak, overbought and poised for a big drop. How it held up today, I don't know--excepting some "fundamental" news that propped up the bulls hopes.
Our hypothetical position, short from yesterday's low, 10728 is now (-76 points). I expect this to be a great trade and it should be profitable tomorrow or Wednesday.
Saturday, March 12, 2005

The DJIA closed the week down 77 points. The price bar turned red today, indicating the beginning of a downtrend.
The stochastics, moving average and CCI all are turning lower. I expect them to continue down.
By the indicators in my new "system", I would take a hypothetical short position today. Again, to eliminate an impossible fill or slippage, I'll assume the trade was at the worst price of the day, the low, 10728. Let's see how far the move goes and how many points the trade will make.
Thursday, March 10, 2005

The Dow moved up 46 points today, but it's really good for our short signal. We can now go short from a higher level. The stochastics indicator is below 80 and the 33-day proprietary moving average turned (very) slightly down today. Tomorrow we'll consider the low price of the day to be our short entry price.
Wednesday, March 09, 2005

The Dow started it's downtrend I think with a 107 point drop today. The stochastic indicator dropped to 79, below the 80 level which is the first part of the signal for my new system. The other confirmation is for the 33 day moving average (the purple line) to turn down. It's still up on the day, but another down day like today and it will go down. Is there any more life in this uptrend? Odds are that it's over.
Tuesday, March 08, 2005

The DJIA closed down more than 24 points today; unable to move higher from the rally of the last few days. The market is poised to fall soon, I think.
I've made one additional modification to my test system. Stochastic indicators are known to be good in markets with cyclical movement, but not in markets when trends occur. Moving averages, on the other hand, are good for trends, but not sideways movement. To combine the positives from both, I'll take a signal when the stochastics breaks above 20 (long signal) and go short when the stochastics drop below 80, after being above it. But, these signals will only be taken if the 33 day proprietary moving average (the purple line) moves in the same direction as the signal. For example, on 26-Jan the stochastics broke above 20 from below that level. However, the purple m.a. line didn't turn up until 2-Feb. If we take the long signal the next day, and use the highest price that day, or 10640, we have a good signal, although a bit late.
Instead of exiting that position and going short when the stochastics went over 80 then dropped below it, on 22-Feb, we're still in the long position because the 33-day m.a. line has gone up without a downward break yet.
Today's close was 10912, so up to this point our paper profit would be 272 points. Not bad.
Because this was done with the effort of hindsight, I'm not going to count this "old" signal, but wait until the next signal, which would be a "short" one and see how this system works for the future.
Monday, March 07, 2005
Friday, March 04, 2005

The DJIA moved off its indecision of the last few days; it spiked up 107 points. Instead of a big move down, it went up (just like gasoline prices at the pump!) Well, the stochastic indicator combined with the price bar colors have given a false signal thus far. I think the market will continue up for a few more days before its drop.
Thursday, March 03, 2005

Yet another seesaw day, a day of indecision where the Dow finally closed up 21 points. This indecision should be resolved soon, either tomorrow or Monday with a downward move which may surprise everyone in it's intensity.
So far, our simulated short signal at 10583 is (-250 points). This should turn around soon.
Tuesday, March 01, 2005

March started with a 67 point up day in the Dow; an inside day, with the high and low of the day within the high and low of yesterday. The level of 10830 or so seems to be a massive resistance level. Should the DJIA pierce that level it may go a lot higher. I doubt it. I think this is a last gasp of the bulls before a big down move.
From 10583, our signal has lost 243 points. (-243 points)


