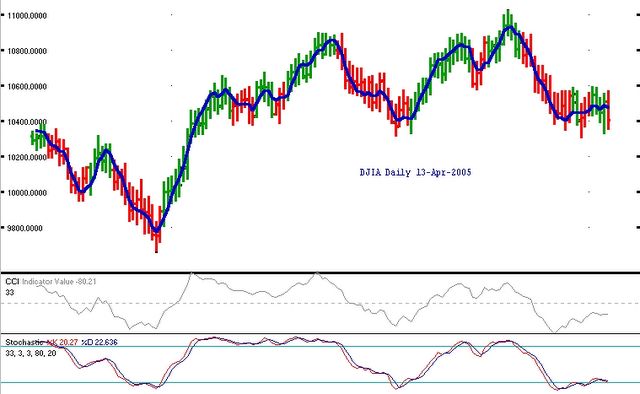
Weekly DJIA through 25-Apr-2005
 The Dow closed up 34 points on the week, like last week not indicating the volatility that existed between Monday's and Friday's session. The indicators are still pointing down and I expect a losing week for the first week of May.
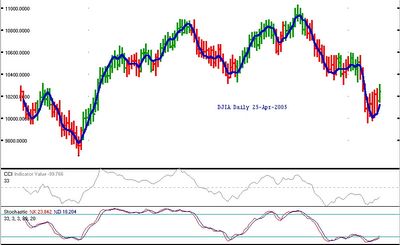
 The indecisive Dow closed up 122 points today. Usually when market direction is questionable, the price range during the day is small. I've never seen days move and down so greatly. The price bar did turn red and I expect the downtrend to resume...one of these days now. The weekly DJIA, the post above shows, is still negative and that is an indication that the daily Dow will resolve this schizophrenia to the downside.
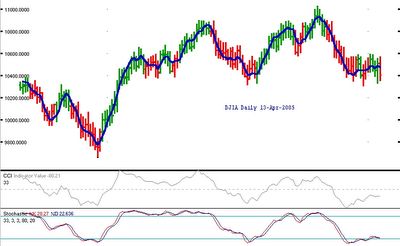
 This unbelievably undecided market continued in its recent ways with 128 point drop today. The price bar is still green, but with the proprietary moving average turning lower, I think the market may drop. Unless tomorrow is an up day, I think we'll break the lows from last week soon.
 The Dow closed up 47 points today. It was a reversal day and I think the beginning of a little up trend. The indicators still point up and the market fought back from a loss to close up. Let's see if tomorrow continues the trend of up-down-up-down or if we have consecutive days in one direction.
 The yo-yo Dow continued today as the market closed down 91 points. Will tomorrow be another big up day? The market still looks like it has a little upside and the price bar is still green. Let's see if we finally get a little break-out to the upside. The weekly indicators are "holding" the market down a little, I think.
 With an 84 point rise today, the Dow has confirmed a move upward. The price bar turned green, the moving average, CCI and stochastics point up and let's see how far this ride up will take us.
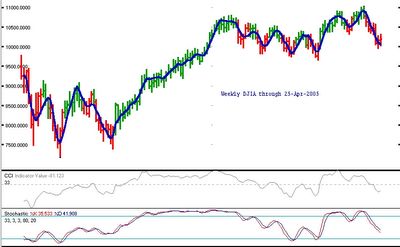
Weekly DJIA through 18-Apr-2005
 The DJIA went up 70 points this week, but like the man with one hand in the fire and one hand in ice water and said to feel average, the market caused pain for both longs and shorts this week. According to this chart the market should go lower and I think this larger trend is keeping the lid on any daily rallies or daily up trends. The market might pause next week, even going up a little more, but the daily prices might go up a bit during the week.
 A 60 point drop in the yo-yo market that is the Dow today. The high-low price bar moved up a little and the indicators at the bottom of the chart continued up a little, as well. I think we will see higher prices from here, a tradable rally. We'll see if next week stops this "one step forward, one step back market" or not.
 The Dow exploded upward, 206 points by the end of the day. Although it's again "almost" a sideways bar, as I said yesterday if the market didn't go down today, I expected the bottom to be in and the market to turn upward. The Stochastics are going up toward 20, but the proprietary moving average made a sharp "v" today going upward. There should be good follow through upward in the market tomorrow.
 The Dow closed down 115 points, but the market seemed to really fall in the afternoon, just stopping at Dow 10000 and then bouncing up 12 points above that mark by the closing bell. You'll notice that today's price bar is another sideways one although the close was 115 points lower than yesterday. I expect more of a decline tomorrow, but if it doesn't come, this could be a temporary bottom as the market is very oversold. Let's see what happens on Thursday.
 The Dow closed up 56 points today. The price bar is still red, but the market continues to be very, very oversold. That condition can continue for a while, as we saw an overbought condition go on for quite a time. As the price bar is basically to right of the last two bars, this still could indicate a price target around 9725, or so. Tomorrow should be sideways or down again, I think.
 Only a 16 point loss in the Dow today, although the market did foray a bit lower during the session. This wasn't the kind of follow-through that I expected and some analysts I heard today were surprised, as well. It seems like we can measure a drop to 9725 or so from the price action of the past couple days. Let's see how it plays out tomorrow.
Weekly DJIA through 11-Apr-2005
 A 373 point drop this week in the DJIA was the biggest fall in quite a while. The CCI crossed the zero line and the stochastics indicator dipped even lower than last week. The red bar will continue next week, I believe, even though it may not be so drastic a fall as this week.
 A 191 point loss today and just the early stages of a big drop in the Dow, I think. The target price is measured out to 9929, another 158 points from here. But is that the extent of the drop? Looking at the weekly chart, above, I believe it indicates much more of a drop to come.
 The market collapsed today, closing down 125 points. The system I'm testing obviously needs further refinement. I still think it has promise, but along with giving some very good signals, there needs to be a filter to stay out of sideways moves or false oversold readings. While I ponder the refinements, the stochastic indicator dropped below 20 again. The weekly chart may need to be given more weight in my new system.
 More sideways movement ending in a 104 point loss in the Dow today. Things seem to be turning negative and the price bar is now red. Let's see if this indecision is resolved up or down in the next two sessions.
Trade to date: -187 points
Previous hypothetical trade: +165 points
Total, to date: -22 points
 What looked like a market meltdown of more than 75 points turned suddenly at 2:00pm EDT and the DJIA closed up 59 points. Today's price action made an outside bar, still green, and we continue to look for temporarily higher prices. This sideways movement is very difficult to predict or trade and we'd like to see an upside breakout soon to confirm our test system.
This hypothetical trade so far: -83 Dow points
Previous trade: +165 points
Total, so far: +82 points
 The Dow closed down 12 points today, but the market's sideways movement hasn't discounted more upward movement in the short run. The price bar is still green and the indicators still above rock-bottom. Tomorrow should be a telling day and should close higher. If it doesn't I'll have to reconsider the hypothetical long trade we instituted a couple sessions ago.
To date: -142 points
Previous trade: +165 points
Total: +23 points
Weekly DJIA through 4-Apr-2005
 Although the weekly DJIA closed up 57 points, all indicators still point to lower prices. The price bar is still red, the moving average, CCI and Stochastics all are going south currently. How does this square with a belief that the daily market is going up? Well, the up-move either will be short-lived, or the weekly market indicators will turn around quickly. They won't stay out of harmony for long.
 Closing 85 points lower, the market appeared to have changed momentum, but I'm still sticking with the hypothetical long position. The price bar high-low today was almost the same as yesterday's price bar. The bars are still green (but we've seen how that can change quickly over the last week's price action). The indicators below the price chart still are looking up. Let's see if Monday confirms our "trade".
This trade: -129 points
Previous trade: +165 points
Total to date: +36 points
 The market moved up 60 points today and the price bar turned green signaling more upward movement. As I mentioned yesterday, with the Stochastics indicator now greater than 20, we would take a hypothetical long position today. As per our extremely conservative approach, I will assume I got in at the worst possible price--the high of the day or 10590. With the weekly indicators pointing lower as of last Friday, I don't know how long this trade might last, but let's see how profitable this system is.
Long from 10590:
So far 1 trade: +165 points
 Another up day, 27+ points in the DJIA. Due to the trading system I'm testing, since the Stochastics indicator just went above 20 today, I’d take a hypothetical long position tomorrow. I was looking for more downside, or at best a sideways move, but I'll go along with the trade.
So far this hypothetical system has produced 1 trade +165 points
 The Dow went up 37 points today, but it looks like sideways movement to me. The price bar is still red, but the stochastics ticked lower again today. The moving average did go up slightly, however. It looks like the rest of the week might move sideways before making up its mind.
So far +165 points
 Even though the DJIA was up around 17 points today and made a "reversal day bar", all other indicators point to lower prices. The price bar turned red, both the CCI and Stochastics went lower and finally the moving average dipped ever so slightly lower, as well. Unless we have a sideways movement beginning, the market should drop lower over the next four sessions of the week.
So far: +165 points
Weekly DJIA through 28-Mar-2005
 Although the Dow only closed down 38 points this week, the market indicators turned even weaker. The CCI indicator is just a hair over the zero line and the stochastics continued downward. Next week should tell if this will be a sustained downtrend or if this is just a correction and the market (and indicators) will move up again.
 After a brief morning rally, the Dow dropped precipitously and closed down 99 points. Instead of an up day confirming a new up trend as I speculated could happen today, the market turned down and with it the proprietary moving average, as well. It's not part of my new hypothetical system test, but I would be tempted to go short again on Monday. Of course, if my system stayed in the short trade it would have made another 99 points.
The weekly chart, above, still looks week. The daily chart continues to be very oversold, but it could get worse.
+165 points so far.