The Dow, as expected, closed down today-75 points lower. It shouldn't take much more to have the Stochastics break below the 80 line and confirm what I expect, which is a downward trend this week.
Weekly DJIA through 23-May-2005
 The DJIA had a 70 point up week this week. Just looking at this chart, the market looks fairly positive--the price bar is green, the proprietary moving average is up and the indicators below the chart have both turned up.
Although the daily chart is very overbought, this longer-term picture indicates a higher week next week. The thing mitigating this is that the Stochastics indicator was on it's way down toward the oversold level when it turned up a month ago. I think the downtrend will continue until that indicator goes below the 20 level. With that taken into consideration the market show go lower next week.
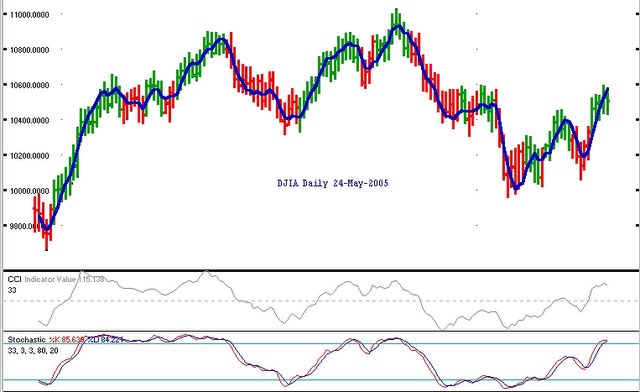
 The Dow closed the week before the long holiday weekend with a paltry 5 point gain. The market could break down at any time now from this overbought level; the only thing that might prolong this uptrend is a sharp upward day. The chances of that are small, so I look for a down week next week (starting Tuesday, of course). I don't think it will get to the 10880 target I mentioned in earlier posts.
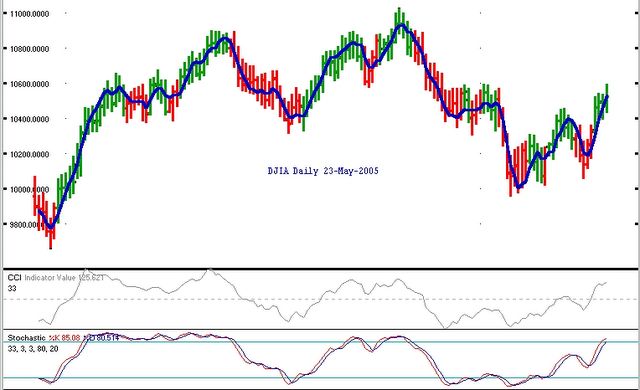
 The Dow went up today, 79 points. The market is still overbought, and the proprietary indicator still declined today. Unless the market goes up tomorrow the moving average will decline further. Does this indicate the up move is over? I think it does, again, unless the market has a decent gain tomorrow. Let's see how this plays out--the market does usually go up before a holiday, but the question is whether the move will be enough to change the direction of the moving average and keep the Stochastics above 80.
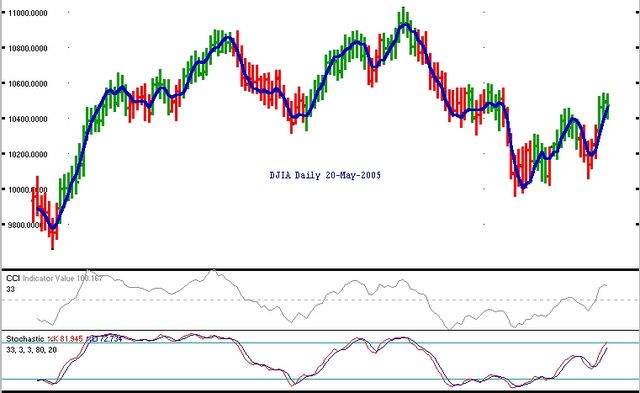
 The Dow went down again, 45 points this time in today's market action. The indicators are overbought still, of course, but today there was a slight dip in the proprietary moving average. I like to see if the market goes down or up tomorrow--I'm not entirely convinced that the uptrend has ended. Before a holiday (Memorial Day on Monday in the U.S.) the market usually goes up in lighter volume.
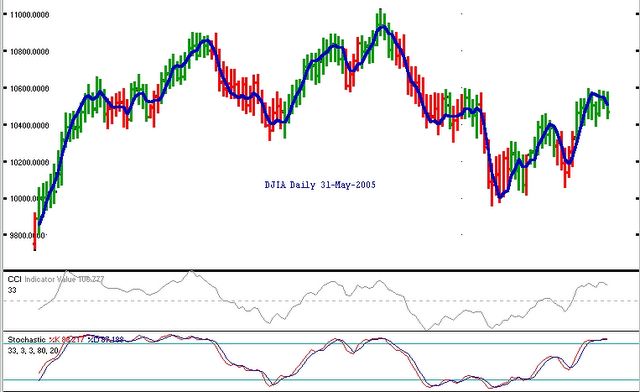
 The Dow closed down almost 20 points today with a basically sideways price bar. The Stochastics indicator is solidly over 80, but the price bar is still green. I projected a target of 10880, but the proprietary moving average could turn down any day now. It's time to be a little cautious.
 The DJIA was up 51 points today, continuing the uptrend. We're still looking at a 10880 target for this move. The Stochastics indicator is now over the 80 level so this market is officially overbought. This condition can last for a while however, but it's something I like to keep an eye on.
DJIA Weekly through 16-May-2005
 The DJIA closed up 331 points this week. The price bar turned green and I expect the market now to go up for at least a week or two. Both the weekly and daily charts are positive now so I expect quick acceleration to the upside.
 A 21 point loss in the Dow closes the week, but today's bar looked like a bar of indecision. This could indicate a halfway point of this upmove. I would measure it to a target price of 10880. There is more upside and I expect that the target price might be reached next week. That's a 400 point week, so it might take a until the middle of the Memorial Day week to reach the target. The stochastic fast (red) line crossed over the 80 mark, the overbought area.
 Another 28 points up on the DJIA today. It took a rise late in the day to bring the index up for the session. The stochastics is getting closer to 80 (74 & 60 currently). I expected another up day, possibly a decent rise, tomorrow.
 The Dow exploded today, closing up 132 points. It looks now like the stochastic indicator, which dipped briefly a few days ago, will now resume until it's in overbought territory, greater than 80. The price bar turned green and more upside is expected tomorrow to end the week.
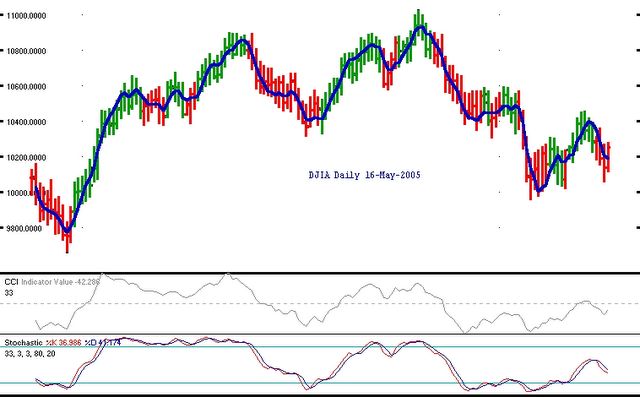
 With an 80 point rise in the Dow today, the indicators, especially the almost prescient proprietary moving average one turned up. The price bar is still red, but I'd now look for the prices to move up because of this development.
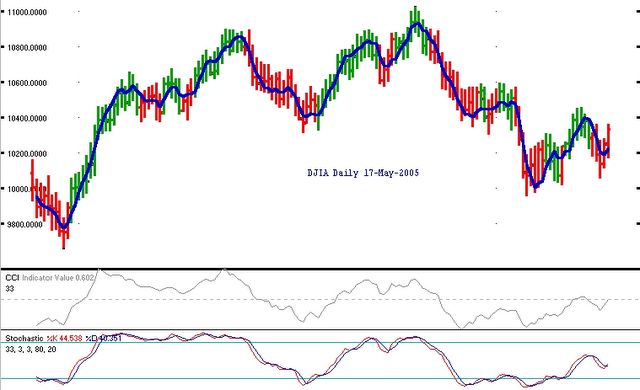
 Despite the DJIA closing up 112 points today, the price bar is still red and the indicators still indicate lower prices ahead. The sensitive CCI is the only one of the line indicators to turn up today. Unless tomorrow is another up day, it should be a sideways to lower one.
Weekly DJIA through 9-May-2005
 The DJIA closed the week down 205 points and the proprietary moving average and CCI turned down. We need another week to confirm if this means an accelerated downward move in the market, or if this is just a pause before starting up again. I favor at least a down move early in the week.
 The Dow closed the week by going down 49 points on Friday. No sign of letup in the downtrend is apparent, so I look for lower prices starting next week.
 The Dow closed down 110 points today in what turned out to be an outside day. Today was further confirmation of the downtrend. Tomorrow, we should see even lower levels.
 Although the Dow closed up 19 points after being down almost 100 points during the day, I still think the market will continue down for a bit. The price bar turned red--another confirmation of the downtrend.
 The Dow tumbled 103 points today and with the proprietary moving average turning downward, I now think the market will go down some from this point. The stochastics indicator never made it to the overbought area, above the 80 mark, so I think the down move won't last long before a final push up--taking the indicator into that overbought territory.
 The Dow closed up almost 39 points on a quiet day in the market. This looks like a little continuation of a sideways move, possibly indicating a halfway point of this upward swing. Let's see if the next couple days offers a breakout to the upside or more sideways action.
Weekly DJIA through 2-May-2005
 The DJIA closed up 152 points this week and the moving average turned up. However, the price bar is still red and more importantly, the stochastics indicator is only a little more than halfway toward the oversold area (< 20). If next week is positive, and I think it will be we may continue with another week or two up, but then more downtrend. The bottom line, the market now looks somewhat positive on the weekly chart and quite positive on the daily one.
 Only a 5 point increase in the Dow today. This sideways movement was something I considered a good possibility. This just is a pause before continuing upward next week. The weekly chart (above) has now turned positive, but there's still a cap on how high the market will go.
 Today saw a 44 point drop in the DJIA and it was a reversal day, but I don't think the uptrend is over. Tomorrow may be a sideways day but that would just signify a halfway point in the up move. The bars are green and the indicators still up; the stochastics indicator is right in the middle of its range. More upside to come, but maybe not until next week.
 The Dow picked up steam throughout the day and closed up 127 points. I drew a trendline on today's chart which was broken today. It touched yesterday's high and a concern was that the prices dropped after hitting that line. Today that line broke like tissue paper. The market still looks very positive.
 The Dow just closed up 5 points today, but the price bar is green and all the indicators are pointing up. I don't expect this to be a big move because the weekly chart looks bad, but the rest of this week and next could be very good.
 The Dow closed up 59 points in a very narrow range day. Again, the short-term looks positive, the daily chart, but the longer term weekly one looks negative. This should put pressure on any upward movement over the next few days. On the other hand, we could still be in a sideways movement--only a few sessions will tell.