Friday, October 29, 2004

DJIA daily chart ending Fri 29-Oct-2004


The market closed up ~23 points today, not a lot of movement toward the target price of 10312. I guessed that the target would be reached by Tuesday, Election Day. However, unless Monday is an almost 300 point up day (Bin Laden's capture, anyone?) the target doesn't seem reachable by the close of business on Tuesday, but we'll see. I don't think a move up to 10312 would indicate any possible outcome for the U.S. presidential election, if the markets don't like the winner the market could tank after hitting the target.

Thursday, October 28, 2004

Price Target - DJIA daily chart Thu 28-Oct-2004


The market only made a small gain +2.5 points and almost made an inside day (meaning the high and low of the day are within the high and low of yesterday's price bar). Even though it's not an inside day, it gives an excellent opportunity for a price prediction and target for this swing up. (Click on the chart to enlarge it)


Price Target for the Dow Industrial Average
The low of the last swing, where the lowest horizontal line is drawn was 9660. That was when people agreed that the market price was too low. The level of the DJIA moved up strongly on Tuesday 10/26 & Wednesday 10/27 and then today the market "took a pause" or consolidated. To me, it's a sign of indecision--will the market go higher or is this the top of the move. The type of bar we see today is indicative of both. In this case, I'll assume that it's just a pause and that the market will continue higher until it goes as far up from this mid-point-line as it did to go from the low up to the mid-point. In other words, the market will get as overbought/overpriced at the target as it was oversold/underpriced at the last low, 9660. The mid-point-line is around 9986 (I just eyeballed the midpoint of today's price bar). 9986-9660= 326 points. 326+9986= 10312 THE PRICE TARGET. I suspect that this target will be reached quickly, within the next two to three trading sessions, bringing us up to election Tuesday in the U.S. When the target is hit, I'll provide more analysis on the market's direction, depending on what prices do after that.

Wednesday, October 27, 2004

DJIA daily chart ending Wed 27-Oct-2004


After a down morning, the Dow went up 113 points today. The price bar for today is green, reflecting the upward momentum in the market. With huge up moves the last two days, I think we may have a pause, even an inside day tomorrow. Even if it's an up day, it won't be another 100+ pts, I think Posted by Hello

Tuesday, October 26, 2004

DJIA daily chart ending Tue 26-Oct-2004


The Dow went up 138 points today. Yesterday's prediction was correct. This is a FREE website. Did any other place tell you the market would go up today?

I used basic chart reading analysis and knowing that the prices had reached an earlier target. The price bar is still red, but if the DJIA goes up for the next few days, as I suspect, the bars will turn green in a day or two.
I'm still trying to figure out a mechanical/mathematical way to confirm predictions like the one I made yesterday. Posted by Hello

Monday, October 25, 2004

DJIA daily chart ending Mon 25-Oct-2004


As expected, the market went lower, but closed off it's low. I expected the market to end in positive territory, but it missed it by just 8 points. The next few days, at least until the election on Tue. Nov. 2, the market should go up. I say this despite the momentum indicators still showing red bars, meaning a downtrend. (click on the chart to enlarge it) Posted by Hello

Sunday, October 24, 2004

DJIA daily chart ending Fri. 22-Oct-2004


As expected, the Dow broke the low of 8/13 and went down to 9732. What will happen on Monday? If the current pattern continues, the market will make a lower low, but close higher on the day. There's also a chance that a sharp downtrend will occur. Only if that happens would I consider the marker to go much lower. Otherwise, a bounce through the election will be my best guess. Posted by Hello

Thursday, October 21, 2004


The market downtrend continues. Note that of the three tops, each is lower than the previous one and the same with the lows. Tomorrow, the market will probably go below the 9746 low of 8/13. Posted by Hello

Return to this journal for my analysis of the Dow Jones Industrial Average (DJIA) trends and price targets. This site is strictly for study and informational purposes--no trading recommendations are proposed Posted by Hello

Wednesday, October 20, 2004

Key to the Charts

The indicator producing the colors is a 7 bar Least Squares Momentum line. The calculation of that is "The program draws a least-squares, best-fit line through a certain number of bars of closing prices. The slope of this line is each day’s momentum value. " This information is taken directly from the charting application I use. The program is Investograph 4.0, purchased from Liberty Research a company whose website is no longer viable. The program appears not to be available any more.

Is it enough to buy the day after a green bar and sell the day after a red bar appears. On the surface this seems plausible, but on closer appearance (and on other charts, not shown), it's more problematic than that. I'm trying to explore how to make those trend directions more meaningful in a predictive way--a way that could lead to profitable trading. To aid in trend direction, there are two moving average lines superimposed on the charts. They are called "proprietary moving averages" by the program, and they have far less lag than traditional moving averages.

As more ideas come up and as some which have been tried prove to be worthless, new indicators will be added to future charts.

NOTE: By clicking on the chart, you'll see a larger version of it.
What’s the purpose of this site?
Many people have said that you can’t predict the movement of the market. I’m going to use tools, studies and indicators and try to see if it can be done. This is just for informational and scientific purposes only, I’m not recommending any trading positions. I will give daily updates on what I believe the direction of the DJIA (Dow Industrial Average) is and where it’s going. I will not cover up mistakes or wrong predictions—it will be all out in the open to study. The Dow is the most widely followed U.S. market indicator and that’s why it will be the focus of these studies.

What methods will be used?
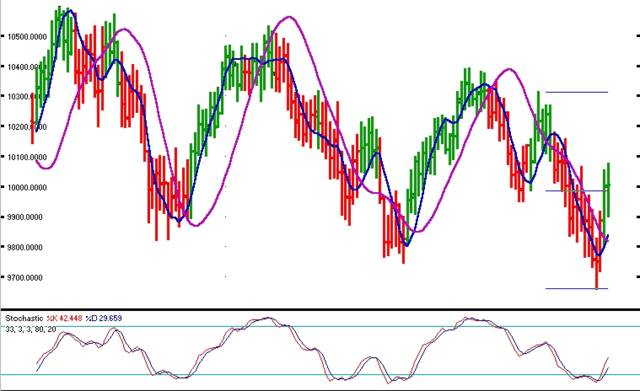
Technical analysis will be used (hence the TekTr8der name) to try to determine market direction and targets. Much technical analysis I’ve found to be useless, and fundamental analysis is included in price and volume levels, I believe. I will discuss what indicators and ideas I’m using in the course of my analysis.

If markets can be predicted, why hasn’t it been done already?
They may not be able to be predicted! However, many people don’t even explore that possibility because they’ve been told that it is, in fact, impossible. Maybe my unique insight and methods will prove worthwhile, maybe not. Obviously, by my creating and maintaining this site, I think I might be successful.

If you can predict the market, why aren’t you rich?
I haven’t been very successful up to this point, but I want the discipline of posting my findings and getting input from you, and others. By sharing what I’ve discovered, I hope to refine my processes and get added information from others.

Trading of this type requires discretionary funds and at this time, I don’t have much! If, through these updates, I find that my methods can be used to predict and make money from the markets, I will trade them myself, and if I feel that it wouldn’t hurt my trading, I will create a separate, pay website.