Monthly DJIA through February 2005
 In February, the DJIA went up 276 points, a nice showing all around. The market is very overbought; as shown by the stochastics indicator below the chart; but you'll notice is was overbought for years during the almost parabolic run up to the 1987 "crash". Not much I can read from this chart with my current level of knowledge, experience and savvy.
 The Dow did another turnaround today, dropping 75 points. The price bar turned green, but I think that's just a misleading indicator in this case. We're now -183 points from our short of 10583. Let's see if that position turns a profit or not. The downtrend, I believe will now fully commence and the market will drop sharply.
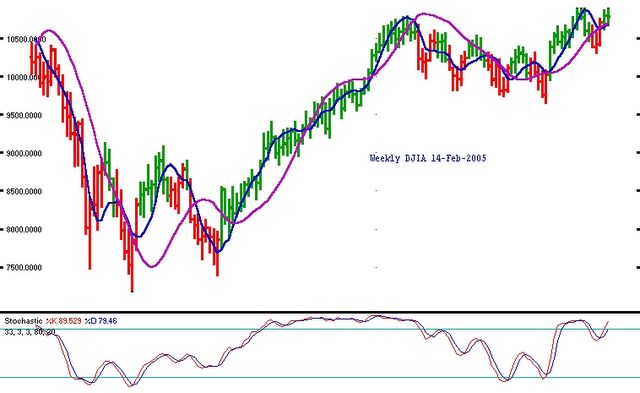
 A 56 point up week in the DJIA continues the market's uptrend. With the stochastics at 92 & 87, it indicates that the Dow is very overbought. The dip we saw a few weeks ago could have been a false one, or what I think, the current uptrend is a last attempt to go up. Soon the bulls will give up and the bears will take over. It could happen this week or next.
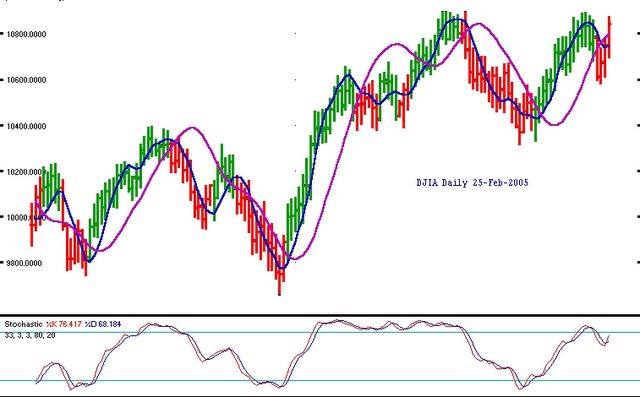
 With a huge 92 point gain for the third big up day in a row, the Dow may still reach our old target of 11100, but as I've abandoned that now and was looking for a drop based on the stochastics indicator, I'm disappointed. The market can do this occasionally, drop, make a fast, last move in the previous direction, then make its real drop. I think that's what's going to happen this time. The stochastics will go over the 80 level again, then when it breaks below it; the market will really drop. I think.
The weekly chart, above still shows a positive trend with green price bars. This week may be the last up week for a while, so we should enjoy it while it has a last gasp.
 The DJIA went up another 75 points today, not yet retracing the 174 point loss of two days ago with yesterday's and today's movement. Today also was a reversal day, going lower than yesterday but closing higher. I still would be short from 10583 or, to date, -165 points. Tomorrow can either resume the downtrend or be part of a last gasp up, a double top before dropping. I still see lower prices soon.
 A 64 point retracement today, but it doesn't invalidate the downtrend that started yesterday. Based on what I said yesterday, We'll assume a short position from the worst possible price today--the lowest price, 10583. How far will it go? We'll monitor the Dow as it drops.
 With the 174 point freefall today, the Dow is certainly starting a downtrend. My upside target of 11100 won't be reached. Other than the target of 10825, this is a few targets in a row that have not been realized and I'm going to try another analytical tack starting now.
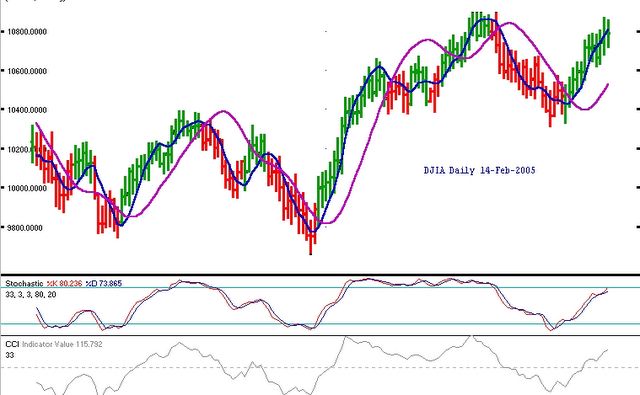
Because the stochastics indicator below the chart has dipped below 80, I'll posit that the chart says to initiate a short position, starting tomorrow. The bar is red and after today's drop, some downward movement is a certainly, I think. I won't exit the imaginary position until the stochastic indicator drops below 20, then rises above that mark. To make it even more challenging, I will record the absolutely worst price tomorrow to go short and count from that point. I'll do the same going long to close this position. That will take any slippage and bad fills out of the equation. In other words, I'll record that a short position will be taken at the low price of the Dow tomorrow.
We'll see how the trade and any future ones do. And again, I won't sugarcoat the results if they are bad.
 The weekly Dow closed down 10 points but the chart looks quite positive. The stochastics indicator at the bottom is again over 80 and the price bar is green. A target can be constructed from this chart of about 11270--higher than the 11100 I've measured on the daily chart. What could make the market move up 400-500 points from here? I don't know, but if a .8% monthly increase in the CPI (minus food and energy) can't make the market tank, like the action on Friday 2/18, the market will take any positive news and overvalue it, I think.
 What looked like a continuation of yesterday's 80 point loss, turned around late in the day and the DJIA closed up around 31 points--a reversal day. We're 315 points from our target and it would take a lot to make it this week. If it will happen, it will probably take until the end of the month. The weekly chart, above looks more positive and I do expect the market to continue up for a bit.
 The DJIA closed 80+ points lower against my prediction of yesterday. The market is still overbought and due for a fall, but I'm still looking for 300+ points, 11100 as the target. Let's see if tomorrow is a turnaround day for a last swing up.
 The Dow was down most of the day, but rallied to close down only 2.4 points. The market is now overbought according to the indicators below the price bars, but the price bars are still green and the moving averages are still pointing northeast. I'm still looking for 11100 as a target price and I think the market will start moving smartly tomorrow or Friday.
 The DJIA ended 46 points higher today, passing our old 10825 target and is on it's way to our new target of 11100. As stated a few days ago, I don't expect it to happen this week, but it should start moving sharply skyward in the next couple days.
 Basically a sideways day today in the Dow average, closing around 5 points lower. I think this is just a pause for the final 300 point push upward. Is anyone else making such a prediction. I haven't heard it in the financial press, if they have. Let's see how tomorrow plays out.
 An interesting change occurred on this chart after this week's price action in the DJIA. With just an 80 point upward move, the price bar has turned green, and the stochastic indicator is back near the 80 line. More evidence that the market, instead of peaking this week as I predicted, still may have another 300 points or so until this upward swing is exhausted. That would mean a very good week, so I'd expect it to take a couple weeks to achieve this target (11100). Let's see if we go straight up from here.
 The Dow closed up 46+ points and reached our target of 10825, going as high as 10829. Is this it for the uptrend, then? Well, now it looks like the market might go quite a bit higher, to 11100 or so. The weekly chart, above, confirms the move has some room to go. If I was in the market and didn't exit at my target, I'd stay in with a close stop below the market and ride it up another 300 points which I believe still remains in this move up.
 Instead of continuing down, the Dow closed up 85+ points today. The bars are still green, the stochastics indicator still pointing NE and the target of 10825 is easily reachable tomorrow. Will it hit the target then drop and continue up on Monday. I think the market is very long in the tooth for this swing. My guess is that the market will push up higher in the morning, then close near unchanged by the end of the day. I don't expect much follow through, but think one or two more up days might be all we have left before a down move in the DJIA.
 The Dow closed 60 points lower today and barring a last gasp upward toward our target of 10825, the market may have started it's downtrend.
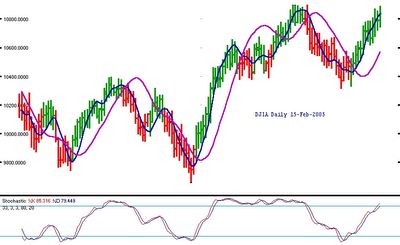
The slow stochastics indicator on the chart has given such good signals over the six month period that the chart covers that I'm thinking of just using those signals for predict the bullish and bearish market swings. I'll address this after more study.
 The DJIA crept up another 8+ points today in another quite aimless session. We're now 100 points below our target and we'll need one last boost to reach it before the market succumbs. The next couple days should tell me if the target will be reached or if the market will again fall short.
 The Dow zig-zagged but ended up nearly unchanged, less than 1 point lower. I'm still looking for another hundred points up before I think the downtrend will continue.
Weekly DJIA through 31-Jan-2005
 The Dow was up 289 points on the week, but with the continued overbought condition, I think the current upward move is about to end around my 10825 target. Next week should see this level reached and then start to fall from there. How far, if my scenario is correct? I'm unsure until I see the market action and find an "indecision" point with which to measure a target price for the drop.
 The Dow shot up 123 points on Friday and is about 110 points from a target I've calculated of 10825.
What happens after that point? Looking at the next chart (above) the weekly DJIA one, the indicators on it make it look like this is just a short-term bounce and then the downtrend will continue.
 The Dow rallied to only close almost 4 points down. Today might be the halfway point of the move up, but we'll see for sure tomorrow.
Monthly DJIA through January 2005
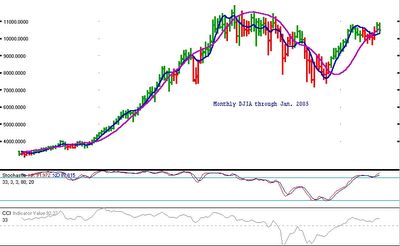 In January, the Dow declined 293 points although the price bar is still green (implying updward price movement). Even with the loss during January, the indicators shown in the bottom part of the chart are still very, very overbought. Now you can see from those indicators that they can stay overbought for months, even years, so those in themselves don't necessarily indicate an imminent down move. Of course, every downmove starts from an overbought condition at some point, but there's no reason to believe this is the time for it. Having said that, the market did decline last month, so this month will show whether the market might move downward or continue it's rise back to old highs. I'm guessing the market will fall, but only the days ahead will show the truth.
 Up another 45 points today, the market continues it's climb without laboring too much. It's still too early to predict how far this upward swing might go, we'll wait for a "sideways" day, or day of indecision before we can measure this move. The indicators, below on the chart, are coming off the bottom, oversold levels they were at.
 After another move up 62 points today, the Dow must be going higher. There's a small chance this is a false breakout, but the bars have been green for three days in a row and the indicators all look positive. No ability to project a target yet, although the last projection was not reached. Let's see how the rest of the week plays out.